Unpacking the Stats NZ Disability Survey
According to the 2023 Survey, 1 in 6 people are estimated to be disabled in Aoteaora. This is about 17% of our New Zealand population .
February 28th, 2025
Every ten years, Stats NZ runs a disability survey after the national census. Collecting and understanding this information is really important as it helps our government services (like health and treasury) make plans for the future.
Things have changed a bit since 2013 when the survey was last collected on on our community. Our population was just over 4 million people (we’re now over 5 million) and COVID-19 was half a decade away.
So much time between has meant Stats NZ has made a change to how they define disability. While this makes things clearer in some ways, it does make it hard to make direct comparisons between what they reported in 2013 and what they’ve found in 2023.
What does the survey show?
Overalll, the Household Disability Survey has shown our government and support organisations that there is a clear need for better accessibility, stronger support systems, and improved policies to help our disabled community in New Zealand thrive.
According to the 2023 Survey, 1 in 6 people are estimated to be disabled in Aoteaora. This is about 17% of our New Zealand population and is a change from the 1 in 5 people from the 2013 survey. They do note that in the new survey, people were only defined as disabled if they experienced a high level of impact every day.
The survey shows a gentle rise in self-reported disability as we get older. Among disabled tamariki (aged 0 to 14), 10% experience disability. Younger adults (15 to 44 years) have a disability rate of 12%, while those aged 45 to 64 experience a rate of 17%. Among kaumātua (65+ years), 35% are disabled.
What did the survey show life is like for our community?
This wont come as news to many but the data confirmed that there are key differences in life experiences between disabled and non-disabled people.
Employment: 56% of disabled adults (15 to 64 years) have a paid job, compared to 82% of adults in the general population.
Education: 73% of disabled adults (15+ years) have a qualification, compared to 87% of adults in the general population.
Health: Only 61% of disabled adults rated their health as good, very good, or excellent, compared to 94% of adults in the general population.Life satisfaction: 68% of disabled adults rated their life satisfaction at 7 or higher, compared to 90% of adults in the general population.
Income adequacy: 47% of disabled people reported having enough or more than enough income, compared to 67% of non-disabled people.
What does this mean big picture?
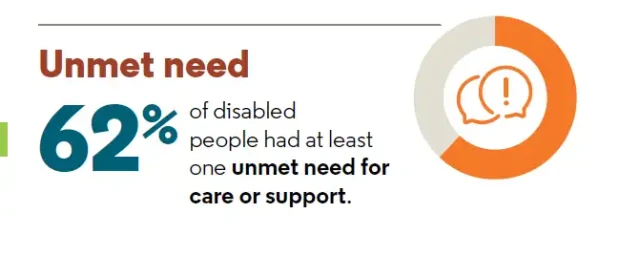
It means that many in our disabled community struggle to access the care and support they need. The survey shows that 62% of disabled people have at least one unmet need.
This data shows there is a significant gap in resources being available to improve our quality of life.
If you’re interested there’s a lot more to explore from the survey results.
Take a look at the full Stats NZ infographic
Visit the Stats NZ website to see the complete report
Well-being support
These numbers can feel overwhelming because they reflect the reality for many in our community. Be sure to take time for yourself and surround yourself with supportive people.
Our wellbeing section is here to help anyone who needs support.